
Eliminating Cloud Waste for a Multi-Cloud SaaS Business
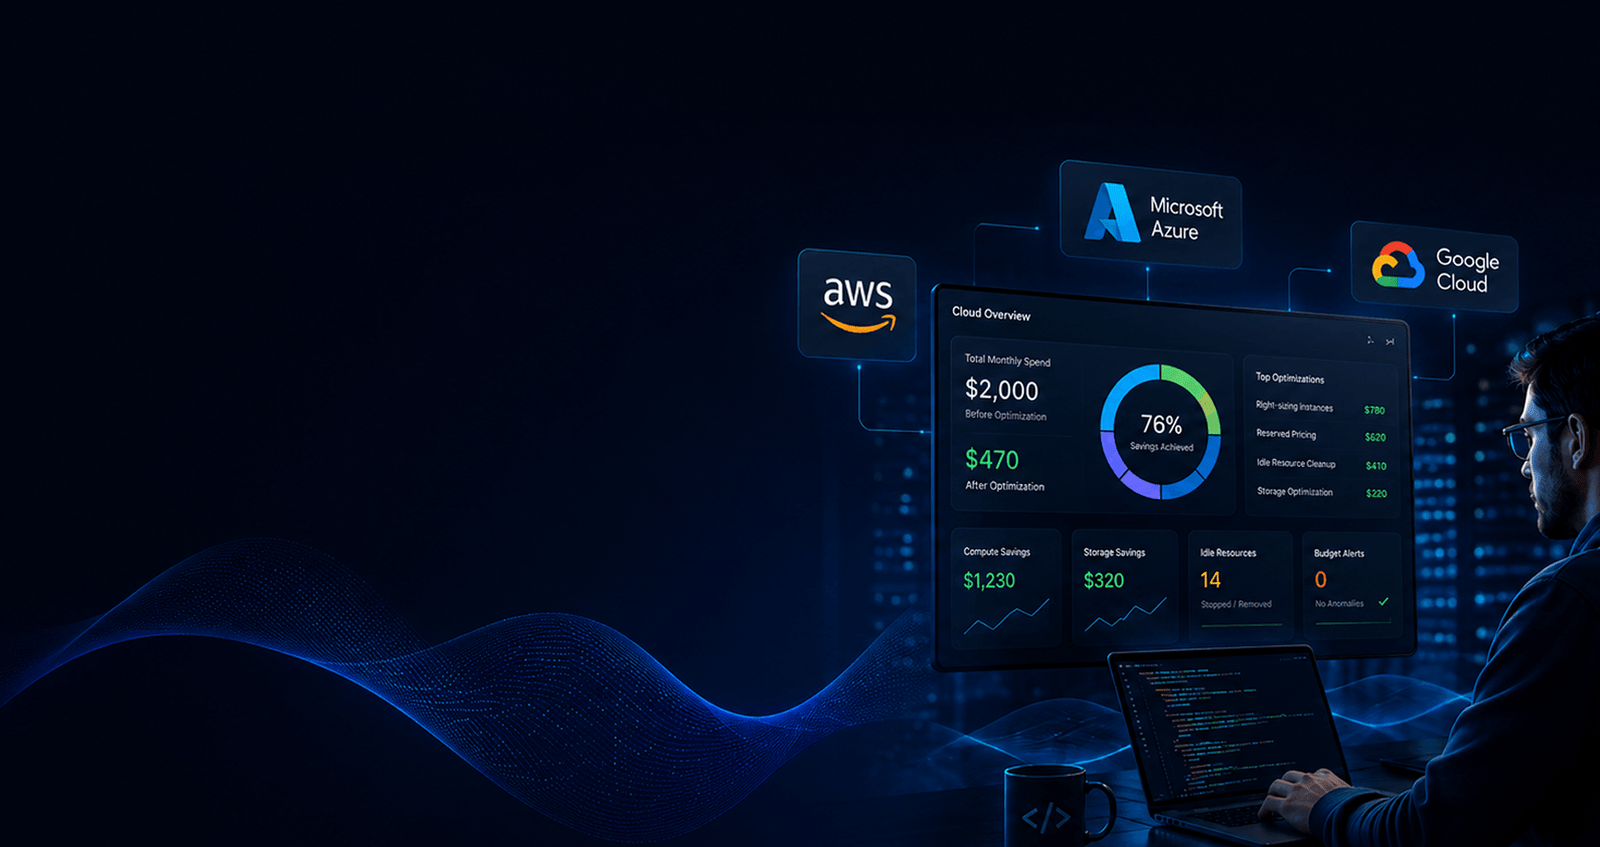
How ClarityOps reduced a client's combined AWS, Azure, and GCP bill by 76%, without removing any feature, changing a production workload, or exceeding two days of total effort.
Book a Free Consultant-
Industry
SaaS / Cloud Infrastructure -
Location
United States -
Service
Cloud Cost Optimization -
Availability
24/7 Automation

MONTHLY BILL. BEFORE
AWS + Azure + GCP combined

MONTHLY BILL. AFTER
Same Workload, Same Uptime

MONTHS OVERPAYING
Before a structured audit

ANNUALIZED SAVINGS
Recovered in under 2 working days

The Challenge
A US-based SaaS client was paying $2,000/month across AWS, Azure, and GCP against a true footprint of $470. Oversized instances, 24/7 dev environments, and orphaned storage had gone unreviewed for nine months, costing $13,000 in avoidable spend.
No cost visibility across providers
AWS, Azure, and GCP each run separate billing consoles with different formats and terminologies. Without a unified view, the client had no way to track spend at the resource level invoices were approved monthly without line-item scrutiny.
Waste went undetected for 9+ monthsOver-provisioned compute from day one
Instances had been sized for anticipated peak loads that never materialized. Servers running at 5–15% average CPU utilization were billed at full capacity, 24 hours a day, seven days a week.
Typical waste: 30–50% of total compute spendDev environments running around the clock
Six development and staging environments across AWS and Azure had no shutdown schedules, operating continuously through nights, weekends, and holidays, generating instance-hours that produced zero business value.
720 billable hours/month of idle environment timeOn-demand pricing for stable workloads
Core production infrastructure had been running unchanged for 12+ months. Despite this, every resource was still billed at on-demand rates, and reserved pricing offering 30–60% discounts had never been evaluated or purchased.
Overpaying 30–60% on stable infrastructureOrphaned resources accumulating silently
Completed projects left behind storage volumes, database snapshots, unattached disks, and reserved IP addresses that no longer served any function, continuing to generate charges with no owner and no decommission plan.
4.2 TB unused storage · 14 unattached volumesNo alerts, no tags, no governance
There were no budget thresholds, no resource tagging policies, and no automated anomaly detection. A runaway process or unapproved resource could generate thousands in unexpected spend before anyone noticed, and it had.
Zero visibility into real-time spend anomalies
The Numbers – Provider by Provider
The overspend was not isolated to a single platform. Each of the three cloud providers had its own distinct waste profile, a product of tooling choices, team decisions, and default configurations specific to how workloads were deployed on each.

Amazon Web Services
Over-provisioned EC2 instances, idle RDS snapshots.

Microsoft Azure
Dev VMs running 24/7, no reserved pricing in place.

Google Cloud Platform
Orphan storage buckets, cross-region egress charges.
Annualized savings from a single focused engagement. The initial 50% reduction was achieved in 2 hours of reviewing the billing dashboard. The remaining optimization such as right-sizing, reserved pricing, storage cleanup, and egress routing, was completed over the following four days, largely delegated to a senior engineer. Total effort: under two working days.
How Nine Months of Overpayment Accumulate
Launch
Infrastructure deployed for launch – sized generously to ensure headroom. The bill looks large but is attributed to setup and early-stage growth. Expected to normalize.
First flags
Bills do not normalize. The team estimates actual consumption should cost far less. A mental note is made to investigate. A client deadline arrives the same week. The investigation is scheduled for next month.
Accumulation
New clients onboarded. Engineers hired. The cloud bill review is delayed again. Over $7,000 in unnecessary spending has now accumulated. The business is growing — the inefficiency feels proportionately smaller against expanding revenue.
Acceptance
The bill is now a known, accepted line item. Total overspend has exceeded $13,000. It appears in the monthly finance review and is noted each time, but it is not a crisis, so it is deferred again. No automated alert. No assigned owner. No deadline.
BOSC Engagement
50% reduction in two hours of structured billing review. Remaining optimization delegated and completed over four days. New run rate: $470/month. Annualized saving locked in: $18,350. Governance framework in place to prevent recurrence.
The BOSC Tech Labs Approach
Rather than applying a generic cost-cutting template, the BOSC team began by developing a complete picture of the client's infrastructure – not just what it cost, but why it cost that much, and which decisions had led to each inefficiency.

-
1
Embedded with engineering and finance teams to understand how infrastructure decisions were made, who owned billing visibility, and where accountability gaps existed across all three cloud platforms.
-
2
Exported and cross-analyzed three months of itemized billing data from AWS, Azure, and GCP – mapping every line item to a specific resource, team, environment, and business function to build a complete cost map.
-
3
Identified the full inventory of active, idle, and orphaned resources across all three providers – including resources the client's team was unaware were still running and generating charges.
-
4
Prioritized actions by impact and implementation speed – separating quick wins executable within hours from structural changes requiring coordinated effort, giving the client an actionable roadmap from day one.
-
5
Implemented all optimizations without disrupting live production workloads – every change was verified against application performance before and after, with zero incidents across the entire engagement.
-
6
Established a governance framework designed to prevent recurrence – ensuring the client maintains full visibility and cost control independently after the engagement closed.
System Architecture Overview
Every client engagement runs through a structured five-stage pipeline – from raw billing ingestion to a self-sustaining governance layer that catches issues before they accumulate.
Cost Ingestion
Billing APIs across AWS, Azure & GCP into a unified view
Resource Mapping
Every resource tagged by team, environment & function
Optimization Engine
Right-size, schedule, reserve, and decommission actions
Governance Layer
Budget alerts, tagging policy, anomaly detection rules
Reporting
Monthly cost reports, anomaly logs & team dashboards
What We Built: Key Capabilities
ClarityOps integrates directly with how engineering and finance teams already operate. No new infrastructure. No workflow disruption. Seven core capabilities delivered.
A single consolidated view of spend across AWS, Azure, and GCP normalized into consistent categories regardless of each provider's native billing format. For the first time, the client could see their total cloud cost picture in one place, broken down by resource, team, and environment.
Monthly savings: ~$120 from uncovering hidden resources and billing inefficienciesUsing AWS Compute Optimizer, Azure Advisor, and GCP Recommender – all native, no-cost tools built into each console – BOSC identified every instance running below 20% average CPU utilization. Eleven instances across three platforms were downsized by at least two size classes, with application performance verified after each change. No downtime. No incidents.
Monthly savings: ~$650 from compute right-sizing aloneDevelopment, staging, and QA environments were configured to operate only during active working hours – 7 AM to 9 PM, Monday through Friday – using AWS Instance Scheduler and Azure Automation runbooks. Operating hours dropped from 720 to approximately 190 per month. A policy requiring explicit tagging for any out-of-hours exception introduced accountability that had not existed before.
Monthly savings: ~$260 from environment schedulingProduction workloads running unchanged for 12+ months were transitioned from on-demand to Reserved Instance pricing on AWS, Reserved VM pricing on Azure, and Committed Use Discounts on GCP. The average discount achieved was 42%. Payback periods for every commitment were under 90 days – a case presented to finance and approved the same week.
Monthly savings: ~$330 from reserved pricing commitmentsA full infrastructure audit identified 4.2 TB of storage data not accessed in over 12 months, 14 unattached disk volumes, 3 unused load balancers, and 6 reserved IP addresses allocated to no active resource. Aging data was migrated to cold storage tiers – Glacier, Cool Blob, and Coldline – reducing storage costs by approximately 80% for that tier. All genuinely orphaned resources were decommissioned.
Monthly savings: ~$165 from storage and orphan cleanupThe analytics pipeline routing data across providers and regions was redirected to pull from a local cloud bucket in the correct environment – eliminating all inter-cloud and cross-region transfer charges on every pipeline run. A separate Azure service misconfigured to route internal calls through a public endpoint was corrected with a single private endpoint configuration change.
Monthly savings: ~$130 from routing and egress fixesA mandatory resource tagging policy was implemented across all three accounts – every resource must carry project, team, and environment tags before provisioning is permitted. Budget alerts were set at 80% and 100% of monthly targets, triggering notifications to both the engineering lead and the CFO. Untagged resources are automatically flagged for review within 48 hours. A recurring 15-minute monthly cost review was embedded into the client's operational calendar.
Future value: catches every anomaly before it accumulates

“ The numbers told us something was wrong for months. What BOSC gave us wasn't just a lower bill – it was the clarity to understand exactly where every dollar was going and the systems to make sure it never drifts again.”
— Engineering Lead, SaaS Client (United States)

The Business Impact
| Area | Before ClarityOps | After ClarityOps |
|---|---|---|
| Monthly Cloud Bill | $2,000 across AWS, Azure, GCP | $470 — same workloads, same uptime |
| Compute Utilization | Instances at 5–15% average CPU | Right-sized to match actual demand |
| Dev Environment Hours | 720 hours/month, always running | ~190 hours/month with scheduled shutdown |
| Pricing Model | 100% on-demand across all workloads | Reserved pricing on all stable production infrastructure |
| Orphaned Resources | Accumulating across all three platforms | Fully audited and decommissioned |
| Data Transfer Costs | Cross-region egress charges on every pipeline run | Eliminated through routing correction |
| Cost Visibility | No unified view invoices approved without review | Consolidated dashboard across all three providers |
| Budget Governance | No alerts, no tags, no ownership | Automated alerts, mandatory tagging, monthly cadence |
| Anomaly Detection | Issues discovered at month-end invoice | Alerts trigger within hours of threshold breach |
| Scalability | Costs grew with every new resource added | Governance framework prevents uncontrolled spend growth |
Reduction in Combined Monthly Cloud Spend
Annualized Savings Delivered
Total Effort to Full Optimization
Cloud Providers Optimized Simultaneously
Our Guarantee
If our initial baseline review does not identify monthly savings that exceed our fee, we do not charge you. In three years of running this process across software companies, manufacturers, retailers, and logistics businesses, we have not yet audited a cloud environment that was not overpaying by at least 25%.

Running this process across industries

Minimum overpayment found in every audit

Average savings identified
See More of Our Work
Explore how BOSC Tech Labs delivers AI-driven solutions across industries:


What's hidden in your cloud bill?
Share your requirements, and we'll help you design a scalable, cost-efficient technology solution that creates real impact for your business.